


Pressure Sensor – Arduino
Introduction
When it comes to connecting a pressure transducer to an Arduino, the process can sometimes be complex and require multiple pins. However, by utilizing the I squared C communication protocol, the task becomes much simpler. In this article, we will explore how to interface a pressure transducer with an Arduino using the I squared C interface.
When it comes to measuring pressure using an analog input pin on an Arduino, it is crucial to understand the conversion equation that translates the analog voltage into PSI readings. This article aims to delve into the equation and provide a step-by-step analysis of how it works.
In this tutorial, we will learn how to display data on both the serial monitor and LCD screen simultaneously. This can be useful when working with sensors or other devices that provide data readings. We will examine the step-by-step process of displaying the data on each platform.
Using Industrial Sensors in Automotive Applications
The Importance of Industrial Sensors
In various industries, including the automotive sector, the use of sensors is crucial for monitoring and measuring different parameters. These sensors provide valuable data that can be used for analysis, monitoring, and control purposes. However, when it comes to using sensors in industrial applications, it is essential to choose sensors that can withstand the harsh environment and still provide accurate readings.
Industrial Sensors in Automotive Applications
In automotive applications, it is necessary to measure parameters such as oil pressure, air pressure, or fuel pressure. These measurements are crucial for ensuring the proper functioning of the vehicle’s engine. Therefore, it is important to select industrial sensors that can survive the challenging conditions within an automotive engine.
Connecting Industrial Sensors to a Microcontroller
To interface these industrial sensors with a microcontroller, such as Arduino, it is necessary to ensure compatibility. This allows the microcontroller to receive the sensor readings and process them accordingly. The sensor readings can then be displayed on a screen that is readable to the human eye and provides real-time information.
The Role of LCD Screens
To display the sensor readings, LCD screens are commonly used. In this case, an LCD screen with the IC communication interface is employed. This allows for seamless communication between the microcontroller and the screen. If a smaller LCD screen, such as a 2 by 16 screen, is chosen, using backpacks that support the IC communication interface is recommended. This simplifies the connection process and ensures efficient data transmission.
Getting Started with Industrial Sensors
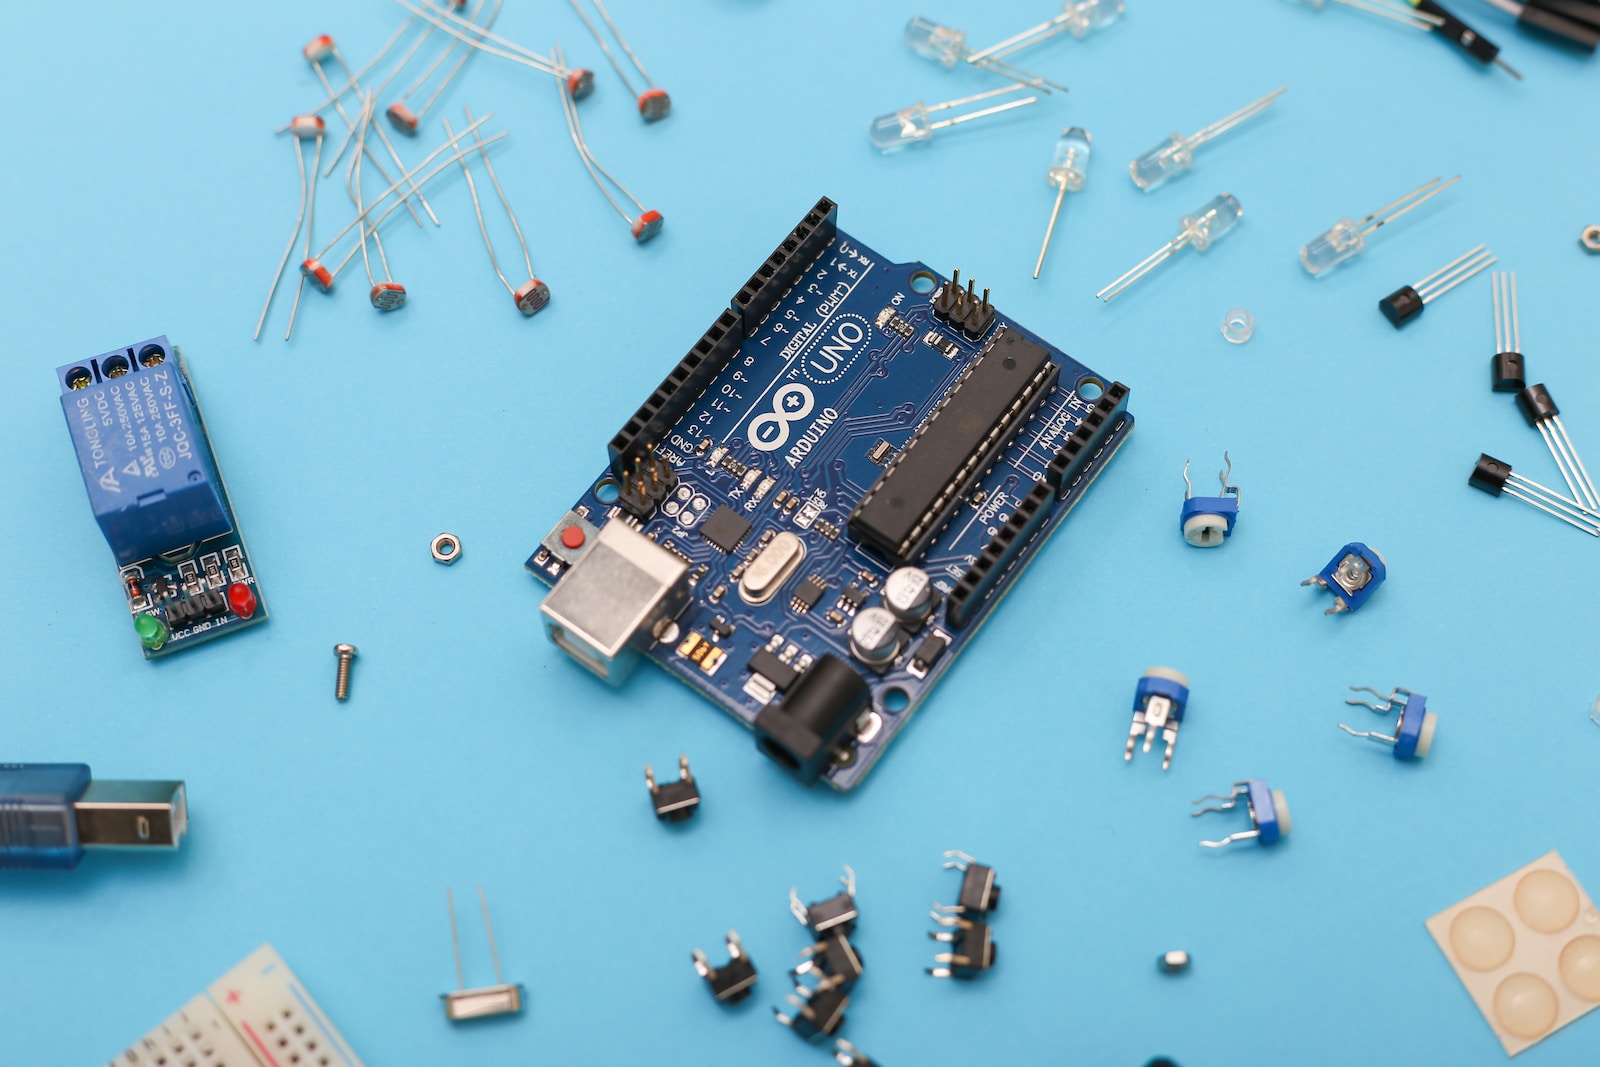
To begin working with industrial sensors in automotive applications, you can easily find pressure transducers and LCD displays on platforms like Amazon. Additionally, an Arduino kit and breadboard are essential components for setting up the necessary connections. Purchasing these items will enable you to embark on your own projects within the automotive field.
Interfacing a Pressure Transducer with an Arduino
Understanding the I squared C Interface
The I squared C interface, also known as I2C, is a popular communication protocol that allows devices to transmit data to each other using only a few pins. In the case of this pressure transducer, only four pins are required for interfacing with the Arduino: ground, five volts, data (SDA), and clock (SCL). These pins easily connect to the corresponding pins on the Arduino, simplifying the connection process.
Connecting the Pressure Transducer
The pressure transducer typically comes with three wires: positive, ground, and signal output. To connect it to the Arduino, simply plug these wires into the appropriate pins. The positive wire goes to the Arduino’s five-volt pin, while the ground wire connects to the ground pin. The signal output wire, which carries the analog voltage signal, should be connected to one of the Arduino’s analog input pins.
Connecting an LCD Screen
If you wish to display the pressure reading on an LCD screen, you will need to connect it to the Arduino as well. Start by connecting the ground pin of the LCD screen to the Arduino’s ground pin. The VCC pin of the LCD screen should be connected to the Arduino’s five-volt pin. Additionally, connect the SDA pin of the LCD screen to the SDA pin on the Arduino, and the SCL pin of the LCD screen to the SCL pin on the Arduino.
Understanding the Arduino Pressure Transducer Experiment
Demonstration
In this article, we will discuss a quick demonstration of using a pressure transducer with an Arduino. The purpose of this experiment is to read the values from the pressure transducer and display them on an LCD screen. We will also explore the possibility of using the setup as a vacuum. While the accuracy of the vacuum side is uncertain, the demonstration proves the functionality of the pressure transducer and the LCD screen.
Setting Up the Experiment
To start with, it is important to correctly label the SCL and SDA pins on your Arduino. These pins are crucial for interfacing with the pressure transducer. Once the connections are made, we can proceed with the demonstration.
The Code
To execute this experiment, we need to use the I squared C library and the LCD screen library. These libraries allow us to communicate with the pressure transducer and display the results on the screen. Before moving forward, it is important to include these libraries in the code.
Defining the Input Pins
In the code, we define a constant integer named “pressure input”. This variable represents the analog input pin connected to the pressure transducer. Depending on the Arduino model you are using, you can choose a suitable analog input pin. In this case, an Arduino Uno is used.
Pressure Transducer Values
The pressure transducer provides different values at zero psi and 100 psi. These values vary depending on the analog pins used. In this experiment, we are using a 100 psi transducer. The specific values for zero psi and 100 psi can be obtained by referring to the datasheet of the transducer.
The Analog Read Function in the Arduino IDE
Arduino is a popular open-source electronics platform that allows users to create interactive projects. One of the key functions in the Arduino IDE is the analog read function. In this article, we will explore how this function works and its practical applications.
Understanding the Analog Read Function
The analog read function in the Arduino IDE enables users to read the analog voltage value from a selected pin and convert it into a digital value. By using this function, you can obtain a numerical representation of the voltage ranging from 0 to 1023, which corresponds to the analog pin’s input.
Converting Voltage to Analog Value
In order to understand how the analog read function works, let’s take an example of a pressure transducer. The pressure transducer provides a voltage output that corresponds to the measured pressure. For instance, at 0.5 volts, the pressure transducer reads zero psi, and at 4.5 volts, it reads 100 psi.
Using a quick conversion equation, we can determine the analog value for a given voltage. We know that there are 1024 possible values for the analog pin. So, by using this formula: x/1024 = 0.5/5, we can find the analog value corresponding to 0.5 volts. Simplifying the equation, we get x = 102.4. Therefore, at 0 psi, the analog input integer value would be 102.4.
Similarly, we can calculate the analog value for 4.5 volts using the same equation: x/1024 = 4.5/5. Simplifying this equation gives us x = 921.6. Hence, at 100 psi, the analog input integer value would be 921.6.
Practical Applications
The analog read function finds applications in various projects where measuring and converting analog signals is essential. Some common applications include:
Temperature monitoring
Light intensity measurement
Sound level detection
Motion sensing
By utilizing the analog read function, Arduino users can accurately convert analog signals into digital data and perform further processing or control actions based on the measured values.
The Basics of Converting Analog Values to Voltage
Introduction
In the world of electronics and programming, analog values play a crucial role in determining various parameters. One such significant parameter is voltage, which is a measure of electric potential difference. Converting analog values to voltage is an essential step in many applications, and in this article, we will explore how to do it effectively.
The Code
To start with, let’s take a look at the code snippet below:
“`c++
Int analogValue = 920;
Int pressureTransducerMaxPSI = 100;
Void setup() {
// Set up necessary configurations
}
Void loop() {
// Read analog value and convert to voltage
Float voltage = analogToVoltage(analogValue);
// Display voltage value
DisplayVoltage(voltage);
// Wait for a delay before next reading
Delay(1000);
}
“`
Converting Analog Values to Voltage
To convert an analog value into a voltage value, we need to use the formula:
“`
Voltage = analogValue * (5.0 / 1023);
“`
In the code snippet, the variable `analogValue` represents the analog reading we obtain from a specific sensor or transducer. By multiplying this value with the conversion factor `(5.0 / 1023)`, we can conveniently obtain the voltage value.
Setting Up Parameters
Before we dive into the code, there are a few parameters that we need to define:
Pressure Transducer Max PSI
The `pressureTransducerMaxPSI` represents the maximum pressure limit (in PSI) of the transducer we are using. Depending on the transducer, we need to input the appropriate value. For example, if our transducer has a maximum limit of 100 PSI, we set `pressureTransducerMaxPSI` to 100.
Baud Rate
The `baudRate` parameter sets the rate at which data is transmitted through the serial monitor. It is essential to match the baud rate in the code with the baud rate in the serial monitor for proper communication.
Sensor Read Delay
The `sensorReadDelay` parameter represents the delay in milliseconds between reading the values and displaying them on the screen. This delay adds a pause to the code execution, making it easier to observe the values without them scrolling too quickly.
Floating Point Precision
To ensure that the values are accurately read as decimal points, we define the variable `pressureValue` as a float data type. This allows for more precise measurements and calculations.
Liquid Crystal I2C
The `liquidCrystal_i2c` initializes the LCD screen. This step is crucial for displaying the voltage values in a user-friendly format.
Converting analog values to voltage is a fundamental skill in electronic projects. By following the code and understanding the parameters involved, you can easily convert analog values into voltage values for further analysis or display purposes. So go ahead, experiment, and create amazing projects with this knowledge!
Understanding the LCD Screen
LCD screens are commonly used in electronic devices for displaying information to the user. In order to communicate with the LCD screen, you need to understand its format and address.
Identifying the LCD Address
Every LCD screen has a specific address that you need to provide when communicating with it. This address can vary depending on the type of LCD screen you are using. There are sketches available that can help you determine the address of your LCD screen.
Number of Columns and Rows
Once you have identified the address of your LCD screen, you need to know the number of columns and rows it has. This information will be crucial when designing and formatting your display.
Initializing the LCD Screen
The initialization process is done in the void setup section of your code. This routine runs once when the system is turned on or reset. In this section, you will need to use the LCD.begin(address, columns, rows) function to initialize your LCD screen.
The Loop Portion
After initializing the LCD screen, you will move on to the loop portion of your code. This section runs repeatedly, allowing you to continuously update the information displayed on the LCD screen.
In this example, the code is reading the pressure value from an analog input pin. The pressure value is then assigned to a variable called pressure_value.
Converting the Pressure Value
To make the pressure value more meaningful, it is often necessary to convert it into a different unit. In this case, the code uses a conversion equation to convert the pressure value into pounds per square inch (psi). The resulting value is then displayed on the LCD screen.
By understanding and following these steps, you can effectively communicate with your LCD screen and display information in a clear and meaningful manner.
The Importance of Analog Reading in Sensor Technology
Sensor technology is an integral part of various industries, ranging from automotive to aerospace. When it comes to measuring pressure, analog reading plays a crucial role in providing accurate and reliable data. In this article, we will delve into the significance of analog reading in sensor technology and explore the conversion equation used to obtain precise measurements.
The Initial Readings
Before delving into the conversion equation, it is essential to understand the initial readings obtained from the sensor. In the provided text, the author mentions that the current reading is at zero psi with a value of 102. Although the exact digital number is not visible, this value serves as a reference point for subsequent calculations.
The Conversion Equation
In order to convert the analog reading into a meaningful pressure value, a conversion equation is employed. The author suggests subtracting the lower value (in this case, 102) from the incoming value, and then multiplying it by the PSI of the transducer being used. Finally, this product is divided by the total range of pressure measured by the transducer. The result is a definitive pressure value in psi.
The Assumption of Linearity
It is important to note that the accuracy of the conversion equation relies on the assumption of linearity between the voltage and the PSI. If the relationship between these two variables is not linear, the equation would need to be adjusted accordingly. Therefore, it is crucial to verify the linearity of the system when employing this conversion method.
Improving Accuracy
The author acknowledges that the current conversion equation may not be entirely accurate and suggests adjusting the code for better precision. By fine-tuning the equation and making it more tailored to the specific sensor and pressure range, the accuracy of the readings can be significantly improved. This highlights the importance of calibration and customization in sensor technology.
Analyzing the Conversion Equation: From Analog Value to PSI
Understanding the Linear Relationship
At the core of the conversion equation lies the assumption that the relationship between voltage (in volts) and pressure (in psi) is linear. In other words, there is a direct and proportional correlation between the two variables. By maintaining a linear relationship, precise pressure readings can be obtained.
Validating the Equation
To validate the accuracy of the conversion equation, a simple experimental setup can be created. By using a small multimeter, the analog input pin can be tested at different pressure points. Beginning with zero pressure, or zero psi, the voltage reading should ideally be zero volts. However, it has been observed that the actual voltage reading at this point is 0.5 volts.
Testing the Sensor
To confirm this finding, the multimeter can be connected between the analog input pin and the ground pin. With no pressure being applied to the pressure transducer, the voltage reading should be approximately 0.5 volts. This aligns with the equation, as it signifies that at 0.5 volts, the pressure transducer accurately reads 0 psi.
Validation Experiment
While it may not be possible to perform the experiment immediately, it is ideal to test the pressure transducer with a proper air compressor setup. By attaching a pressure gauge to the air compressor and adjusting it to 100 psi, the sensor can be subjected to various pressure levels within its range. This experimentation will provide further confirmation of the conversion equation’s reliability.
Displaying on Serial Monitor
To display data on the serial monitor, we use the “Serial.print()” function. This function allows us to print values to the serial monitor window. For example, if we want to display the pressure value, we would use the following code: “Serial.print(pressureValue, 2)”. Here, “pressureValue” is the variable containing the actual pressure reading, and “2” specifies the number of decimal places to be displayed.
Displaying on LCD Screen
To display data on an LCD screen, we need to use the LiquidCrystal library. First, we need to set the cursor position to the desired location on the screen using the “LCD.setCursor()” function. For example, “LCD.setCursor(0,0)” sets the cursor to the first column of the first row.
Next, we print the label and the value using the “LCD.print()” function. For example, “LCD.print(“Pressure: “)”. This will display the label “Pressure: ” on the LCD screen. Then, we use “LCD.print(pressureValue, 1)” to display the pressure value with one decimal place.
Handling LCD Screen Overflows
If the data value goes over two digits or into the negatives, it may cause the LCD screen to display incorrect characters. To avoid this issue, we need to clear the LCD screen before printing the data again. We can do this by using the “LCD.clear()” function. This ensures that the previous value is cleared before printing the new value.
Clearing the Screen Easily
Clearing the screen is a common task when working with digital devices. However, it can sometimes be time-consuming and tedious to clear the entire screen. Fortunately, there is an easy way to clear just a portion of the screen without having to clear the entire thing. In this article, we will explore this simple technique.
Understanding the Clear Command
The first thing you need to know is that the clear command is followed by the digits right after “psi.” These digits represent the portion of the screen that you want to clear. By specifying the digits, you can choose exactly what area of the screen to clear, saving time and effort.
Delay Between Readings
Another important aspect to consider is the delay between readings. This refers to the time gap between each value being read and displayed on the screen. By adjusting this delay, you can control the speed at which the readings are updated.
Examining the Results
Once you have implemented the clear command and set the delay, it is time to take a final look at the screen and see what it looks like. This step ensures that everything is working correctly before proceeding further.
Using the Pressure Transducer
In this project, we are utilizing a pressure transducer as a pressure sensor. The transducer allows us to accurately measure pressure and convert it into psi values that can be displayed on the screen. By giving the pressure transducer a final blow, we can verify that it is functioning properly and providing accurate readings.
Expanding the Project for a Truck
The potential applications of this project extend beyond a simple demonstration. The author plans on scaling up this project for their truck, an older 92 dodge. The goal is to transform the truck into a pre-obd2 computer, capable of monitoring various input sensor values such as oil pressure, fuel pressure, and turbo pressure. Additionally, the project aims to include monitoring of the incoming voltage from the battery.
Future Enhancements
While the project is still in progress, there are a few additional components that are yet to arrive. Among these components are a voltage sensor, which will enable the author to read the voltage value of the battery, and a voltage regulator, which will ensure the stability of the incoming voltage. These additions will further enhance the capabilities of the project.
Exploring Voltage Regulation for Arduino System
Arduino is a popular computer system used in various projects. One of the essential aspects of working with Arduino is ensuring that the incoming voltage is compatible with its requirements. In this article, we will discuss the significance of regulating the voltage and explore some additional components that can enhance the Arduino experience.
The Importance of Voltage Regulation
Voltage regulation is crucial for the proper functioning of electronic devices, including Arduino. The standard voltage input for an Arduino system is 5 volts. However, the incoming voltage is often higher than this, such as 12 volts from a power source. Regulating the voltage ensures that the Arduino operates within its specified limits and prevents any damage.
Regulating Voltage from 12V to 5V
To regulate the incoming 12 volts to the required 5 volts for Arduino, various voltage regulators can be utilized. These regulators efficiently convert the higher voltage to the desired level. By using a suitable voltage regulator, one can ensure a stable power supply to the Arduino, enabling it to function optimally.
Integrating Thermocouple to Measure Exhaust Gas Temperatures
In addition to voltage regulation, there are numerous other components that can enhance the capabilities of an Arduino system. One such component is a pyro k-type thermocouple. This thermocouple is specifically designed to measure exhaust gas temperatures. Integrating the thermocouple with Arduino allows users to monitor and analyze temperature changes, enabling them to make informed decisions in various applications.
Expanding the Project with Additional Components
Apart from the voltage regulator and thermocouple, there are several other components that can further enhance the Arduino project. These smaller components can add more functionality and versatility to the system. While the specific components may vary based on the project requirements, exploring and adding these additional goodies can make the Arduino project a truly engaging and ongoing endeavor.
Your Ongoing Arduino Project
As you embark on your Arduino project, remember the importance of voltage regulation. By using a suitable voltage regulator, you can ensure a stable power supply to your Arduino system. Additionally, consider integrating a pyro k-type thermocouple to measure exhaust gas temperatures. This will enable you to gather valuable data and expand the possibilities of your project. Don’t forget to explore other small components that can add more excitement and functionality to your ongoing Arduino journey. Embrace the possibilities and enjoy the process of creating with Arduino.
Industrial sensors play a vital role in automotive applications, allowing for the measurement and monitoring of critical parameters. By selecting industrial-grade sensors and connecting them to a microcontroller, such as Arduino, it becomes possible to collect and process sensor data. This data can then be displayed on an LCD screen for real-time monitoring and analysis. Whether you are an automotive enthusiast or a professional in the field, exploring industrial sensors and their application can lead to exciting projects and innovations.
By utilizing the I squared C interface, connecting a pressure transducer to an Arduino becomes a straightforward process. With just a few simple connections, you can easily interface the pressure transducer with the Arduino, allowing you to measure and monitor pressure readings accurately. Furthermore, if you wish to display the results, connecting an LCD screen is also hassle-free. So, go ahead and start experimenting with pressure transducers and Arduino today!
By following this example, you can successfully read the values from a pressure transducer and display them on an LCD screen using an Arduino. While this experiment serves as a simple demonstration, it showcases the potential of the Arduino platform for various applications involving sensors and displays. If you have any questions or would like to access the code used in this experiment, please refer to the description box below or contact me via email.
The analog read function in the Arduino IDE serves as a valuable tool for converting analog signals into digital data. By understanding its working principles and applications, users can leverage this function to create innovative and interactive projects. Whether you are a beginner or an experienced Arduino enthusiast, mastering the analog read function is essential for unlocking the full potential of the platform.
Analog reading plays a vital role in sensor technology, particularly when measuring pressure. By employing a conversion equation, it is possible to transform the analog readings into meaningful pressure values. However, it is crucial to consider the linearity of the system and customize the equation accordingly for accurate results. With continued advancements in sensor technology, the ability to obtain precise and reliable data is constantly improving.
The conversion equation, which translates analog voltage readings into PSI measurements, relies on the assumption of a linear relationship between the variables. By testing the analog input pin with a multimeter and validating the equation with a proper setup, the accuracy of the conversion can be assessed. By understanding and confirming the conversion equation’s reliability, accurate pressure readings can be obtained using an Arduino and analog input pin.
By following the steps outlined in this tutorial, you can easily display data on both the serial monitor and LCD screen. This allows for convenient and efficient monitoring of sensor data or any other values in your projects. Remember to handle any potential overflows on the LCD screen to ensure accurate display of data.
Clearing the screen in a targeted manner is now made easy with the clear command. By specifying the desired portion of the screen to clear and adjusting the delay between readings, you can effectively display accurate readings without clutter. This simple technique can be applied to various projects, including the author’s plan to create a pre-obd2 computer for their truck. By expanding the project with additional input sensor values and battery monitoring, the truck’s performance can be efficiently tracked and optimized.


